FF Data Bites: Social Token Tags Network Analysis
This post is a guest essay from Omni Analytics Group. Omni Analytics Group is a group of passionate technologists who help others use data science to change the world.
This post is a guest essay from Omni Analytics Group. Omni Analytics Group is a group of passionate technologists who help others use data science to change the world.
Introduction
Social tokens are cryptocurrencies that enable a share of value between content creators, artists, builders, and other community members with a shared interest. This can allow creators to monetize access to their content, but also can simply provide a community with a currency that, due to their shared interests, has inherent value to each of them.
Forefront aggregates news, insights, and other content about social tokens and DAOs. The team at Forefront tracks data on the tokens listed on its market.
These tokens vary in terms of the communities they cater to and the goals of each. For example, MetaGame bills itself as "a weird combination of a social network, a freelancing platform & an MMO-RPG." Harrison First, as the name suggests, is a creator-based token tied to the DJ Harrison First. Bankless DAO focuses on raising awareness of bankless money systems.
Because the variation in these tokens is so large, Forefront attempts to categorize them by using tagging. For example, the previously mentioned MetaGame is tagged as "metaverse," but also "tooling," "community," and "membership." Harrison First is tagged as, among other things, "NFTs" and "entertainment." These tags help users discover, at a glance, the community or communities a particular social token is targeting. In addition to tags, social tokens are also broken down by utilities. In the case of MetaGame, its utilities include "access," "governance," and "servicing." Harrison First also has "access" and "servicing" as listed utilities, while some other tokens have "NFTs," "payments," and more. This categorization in terms of tags and utilities helps to break down the list of social tokens into relevant characteristics and highlight those that might appeal to a certain individual or group.
Network Analysis
Since we have a breakdown of the tags and utilities associated with particular social tokens on Forefront, we can actually perform a network analysis by using the shared tags and utilities to derive a metric of similarity. This can allow us to visually represent how interrelated a set of social tokens are based on these characteristics. To do that, we needed to scrape and collect the tags and utility data.
To perform the data collection, we called the Forefront API, retrieving data for the tokens tracked on the site. This loop was done with R, using supporting packages tidyverse for data manipulation, and httr for making synchronous API calls.
To create the utilities network graph, we needed to create a graph structure out of the data. Graphs are represented by nodes -- in this case, the social tokens themselves as well as the utilities -- and edges. The edges between nodes are defined by sharing a utility. The graph is shown below. We immediately see that "governance" is a utility that binds many of the social tokens together. We also see that certain social tokens are more interconnected by virtue of having a wide variety of utility, such as MetaGame.
The same procedure can be used with the tags, and doing so produces the following network graph. This graph is busier due to the larger number of tags, but we see a distinct "cluster" of social tokens with shared tags, followed by an orbit consisting of the social tokens with less common or more distinct tags, like DeFi Omega with the "investment" tag, or Yup with "reputation."
We have produced interactive versions of these graphs here. You can interact with the graphs yourself and see what interesting or unexpected connections or relationships you find!
Benefits Analysis
Next, we collected data on the benefits that each social token provides to its holders. The benefits are roughly broken down into three distinct categories:
- Access: Being granted access to exclusive content or a community.
- Earn: The ability to earn more of that token by doing some task.
- Redeem: The ability to redeem that token for items or content.
While many of the tokens offer some form of access or earnings, very few offer the ability to redeem, which was a distinguishing characteristic of just a handful. Because of the hierarchical nature of this data, we were able to break it down into a dendrogram, which traces the three different types of benefits to the tokens that offer them, and then a description of what specifically those benefits are. The dendrogram is shown below. We immediately see that "access" is the benefit given by the largest number of social tokens, where only three provide the ability to redeem for rewards. Interestingly, some tokens break down their benefits even within a particular category at a more fine-grained level. For example, SKULL lists four separate access benefits that are all related to Discord access tiers.
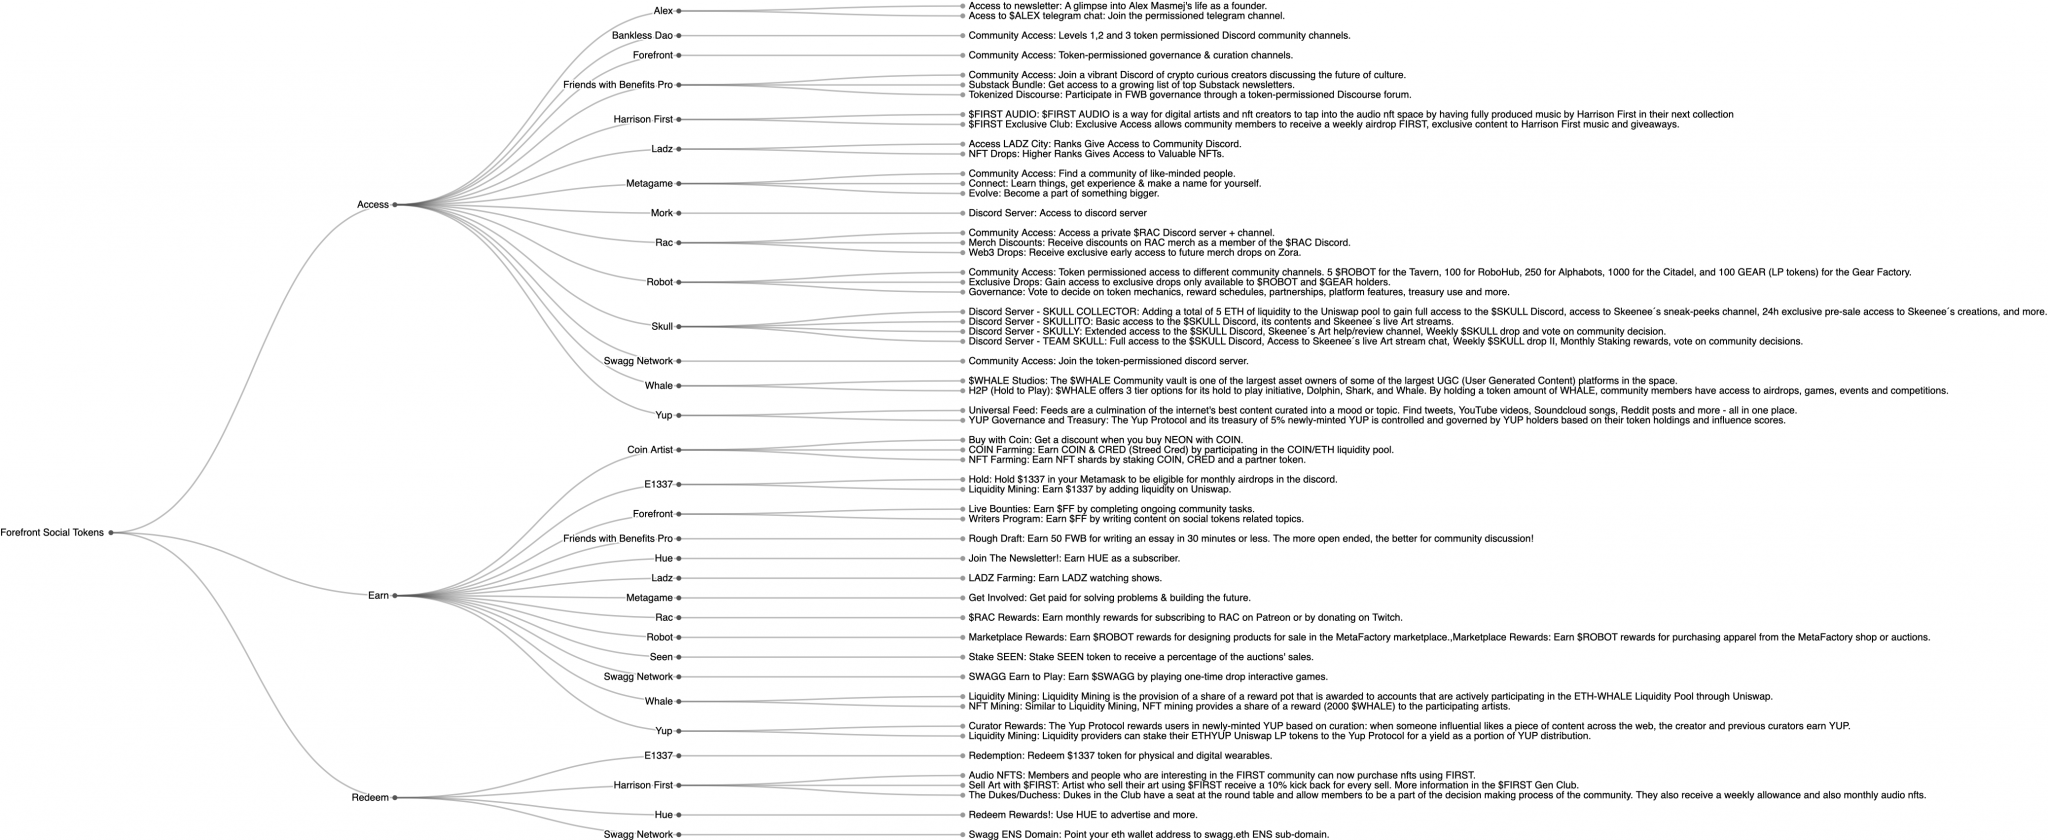
Forefront tracked tokens benefit analysis.
We can restructure this view in a slightly different format, flipping the token to the beginning and then splitting the benefits offered by that token from there. That graph is shown below. This representation allows us to better analyze the benefits offered by a specific token and see them in the chart together. For example, the Swagg Network offers one benefit from each category in this representation of the data.
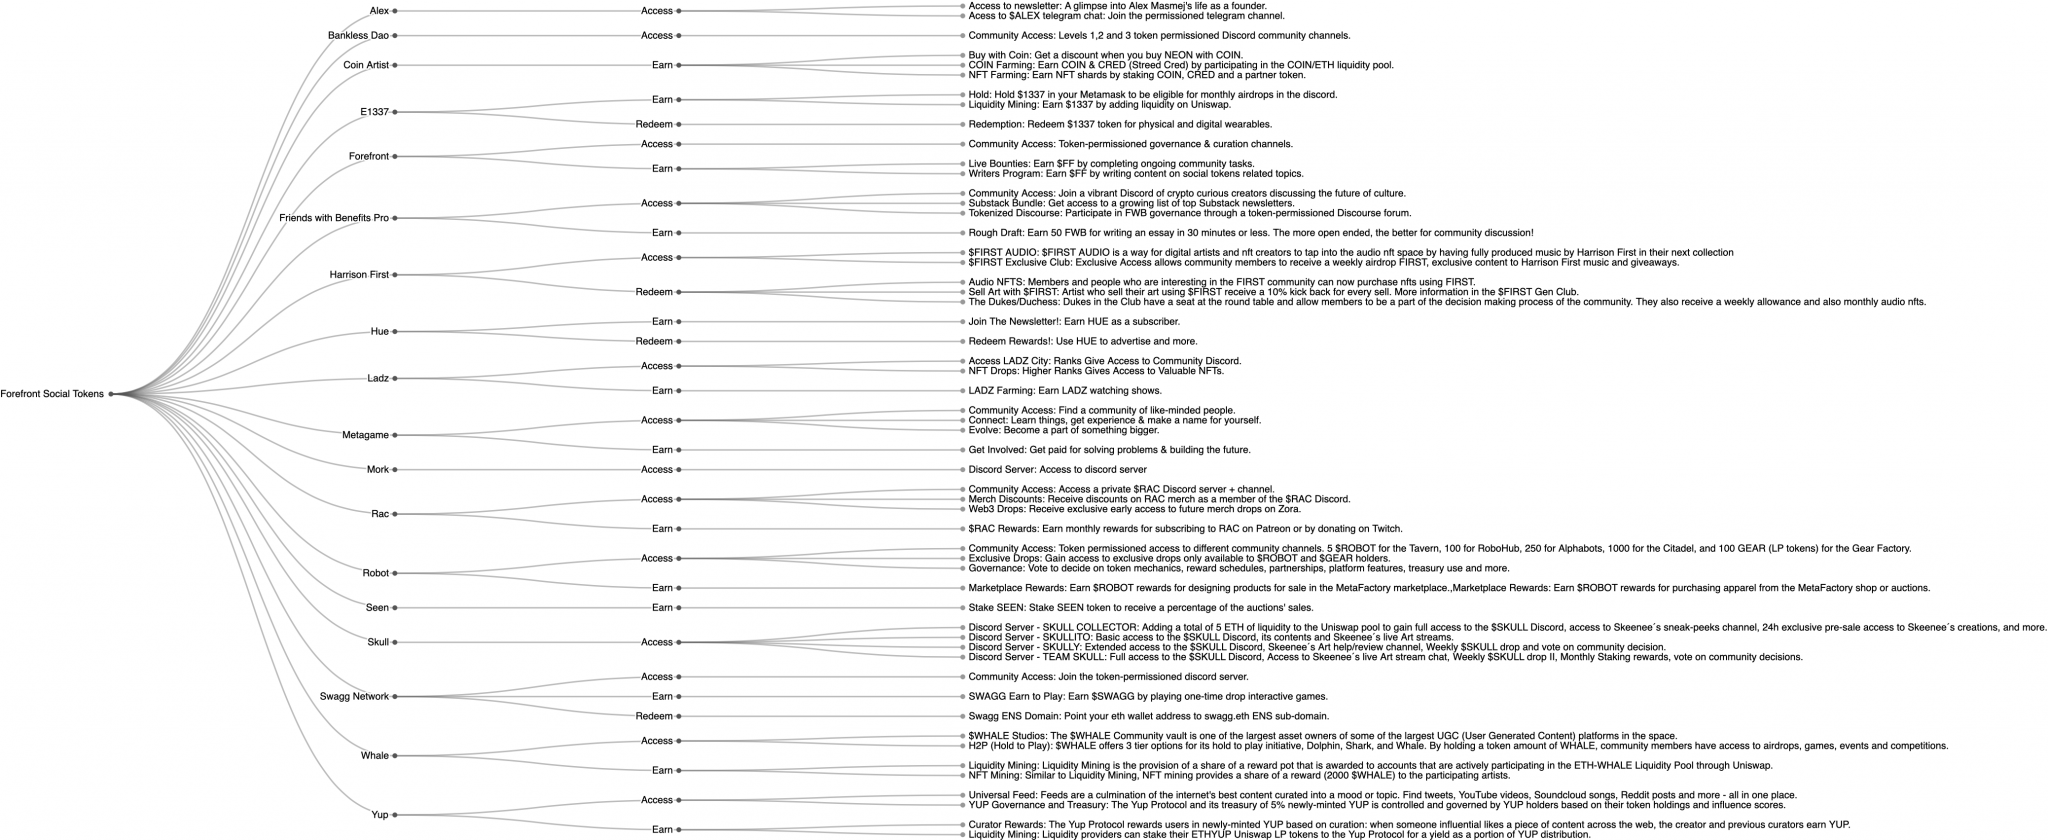
Forefront tracked tokens benefit analysis (alt format).
Conclusion
This analysis highlights the way data science and analytics can be used to better understand characteristics of social tokens. In this case, we were able to use simple tags, utilities, and benefits data to order tokens with shared characteristics, and visually represent these characteristics in a simple yet appealing way.
As Forefront continues to grow, we look forward to performing a reprise of this analysis. If you have any further suggestions or ideas about what can be done in a future iteration of this analysis, please share and we will see what can be done!